Free PERT/CPM Calculator — find the Critical Path online.
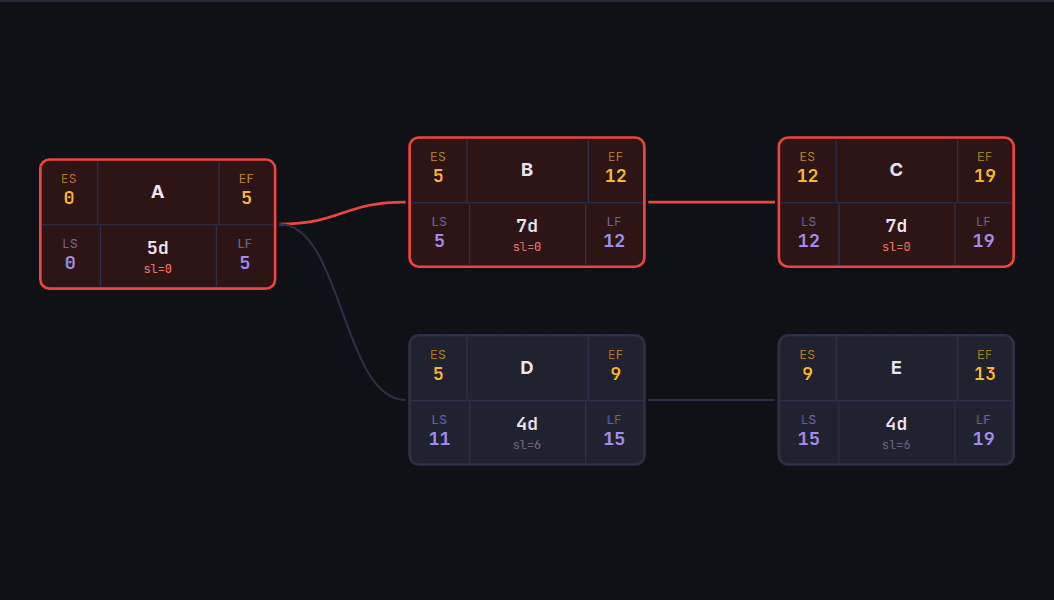
Build your network diagram, enter durations and dependencies, and the critical path method (CPM) computes ES, EF, LS, LF and slack for every activity — with a Gantt chart generated from the same data. No sign-up.
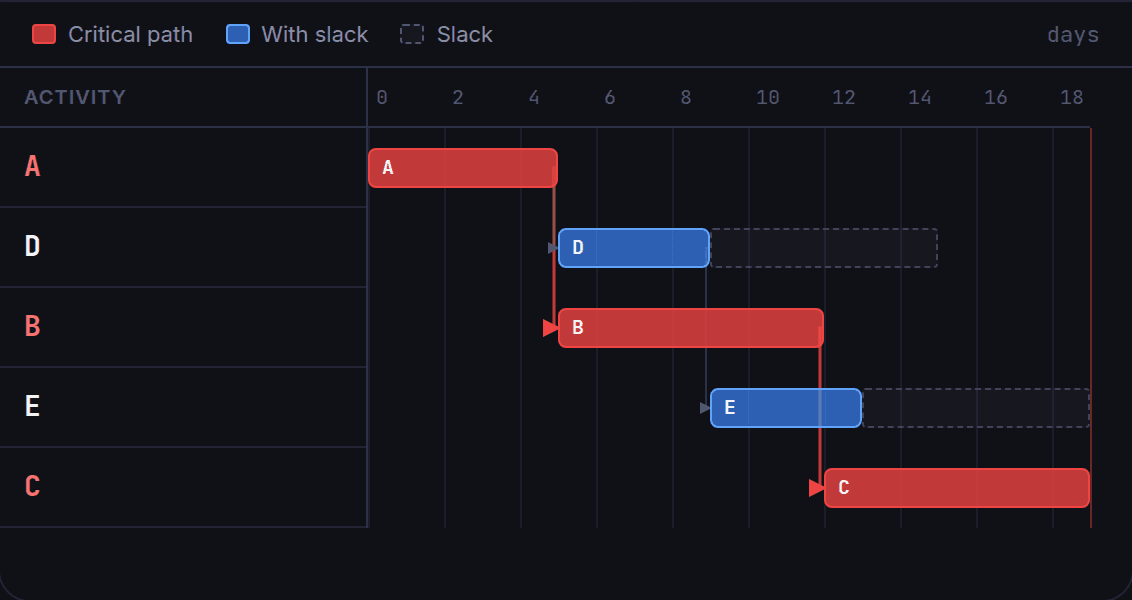
The same project, now on a timeline.
The Gantt chart is generated straight from the CPM result: red bars are exactly the critical activities, and the dashed outline shows the slack of each flexible task. Network diagram and Gantt always match because they come from the same data.
Learn PERT/CPM step by step.
Understand what each value means and how to compute it — ES, EF, LS, LF, slack and critical path — with a fully solved 14-activity construction project and focused diagrams for each step.
Need to actually track the project?
The calculator stays free and offline. When you want, create an account and take your projects to the cloud — with sync on any device, finish-date forecast and delay tracking. Your browser projects come along, in 1 click.
Frequently asked questions
▾Is the tool really free?
Yes — completely free and no sign-up. It runs entirely in your browser and your projects are saved locally.
▾What's the difference between a Gantt and a PERT/CPM diagram?
The PERT/CPM diagram shows activities as a network of nodes with dependencies and computes the critical path. The Gantt shows the same schedule as bars on a timeline. The tool generates both from the same data, so they always match.
▾How does the critical path show up?
Activities with zero slack are drawn in red, connected by red arrows. That chain is the critical path — the sequence of tasks that determines the total project duration.
▾Can I export my project?
Yes: export as CSV or PERT JSON, and the network diagram as a PNG image. The activity data travels with the export.
Contact us
Have a suggestion, found a bug, or just want to say hi?